- 60/100median mobile performance score
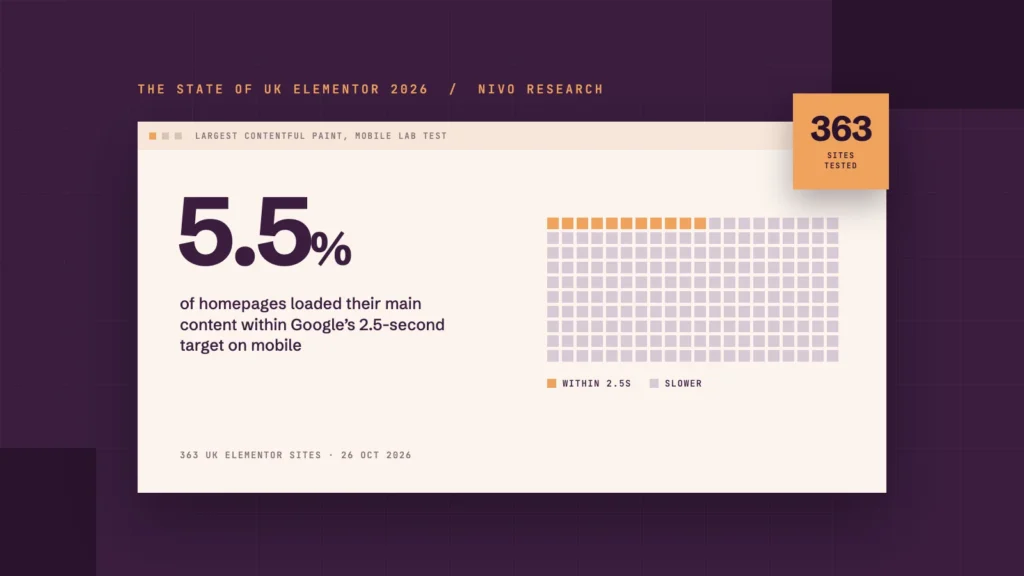
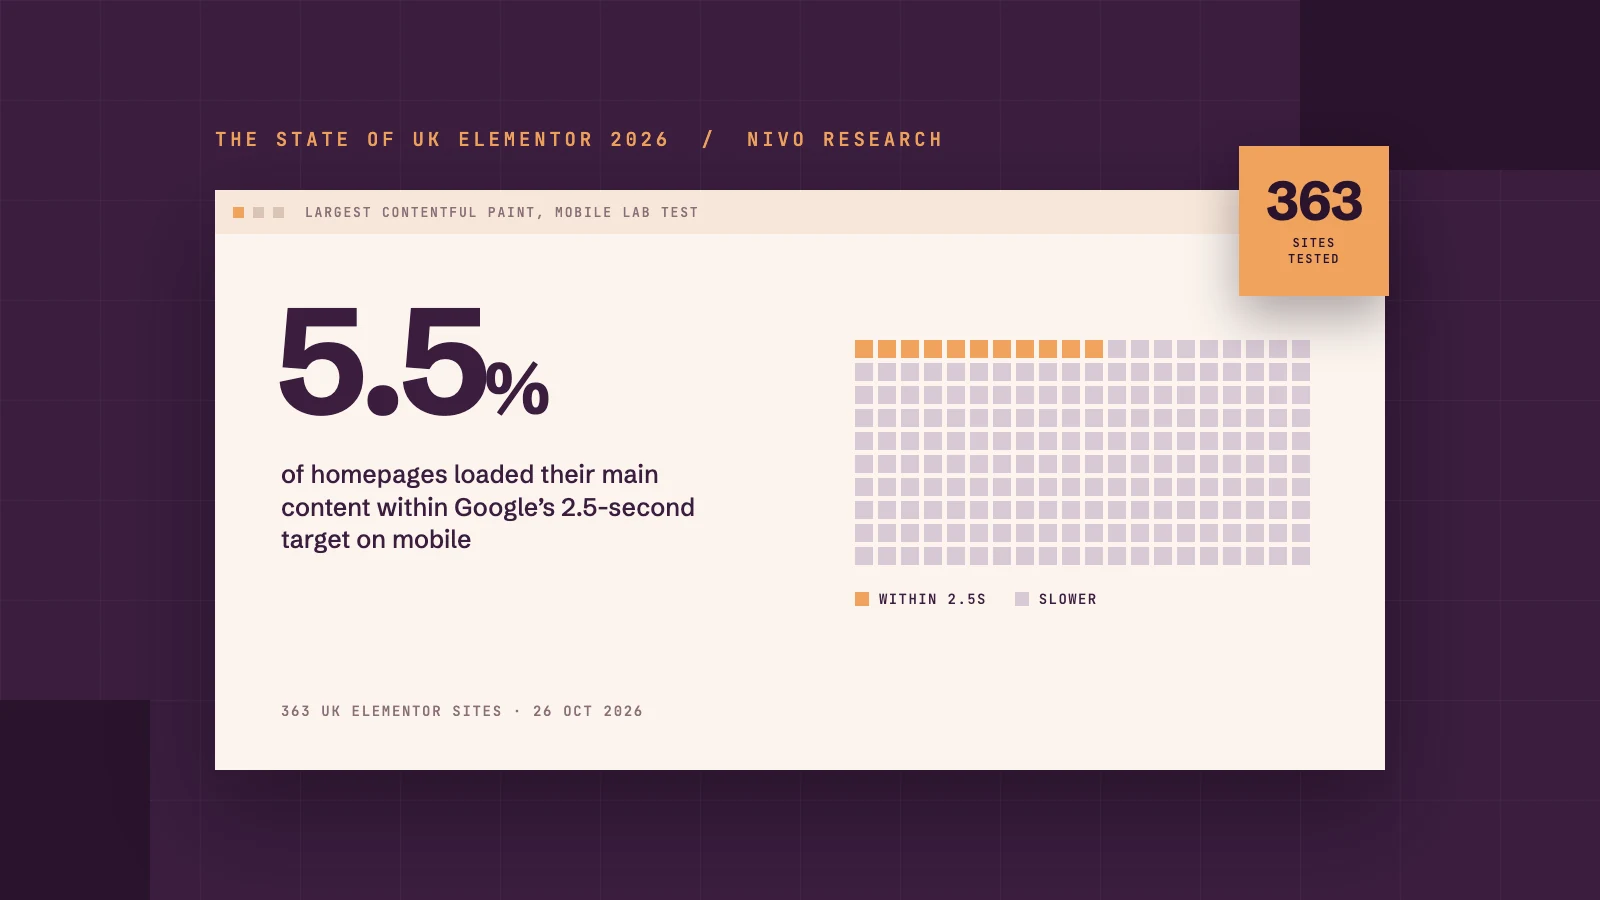
- 5.5%loaded their main content (LCP) within Google's 2.5-second target
- 87%had good layout stability (CLS)
In our experience, Elementor often gets the blame for slow websites. So we wanted to put this claim to the test, especially as we're Elementor experts and build websites in Elementor every day.
To do that, we tested the homepages of 363 UK business websites that use Elementor. The results were clear on loading speed: only 5.5% loaded their main content within Google's recommended 2.5 seconds on mobile. Server response was rarely slow: the median site started sending its page in 78 milliseconds, and layouts held steady on most sites. Slower sites tended to be heavier. Homepages under 1MB took a median of 3.3 seconds to show their main content in Google's mobile test. Homepages over 5MB took 20.7 seconds.
The sites we tested belong to accountants, law firms, care providers, construction firms, tradespeople, interior designers and cafés across eight UK cities. We found them on Google Maps, the same way their customers would, and ran every homepage through Google PageSpeed Insights on 26 October 2026. Here's what we found in The State of UK Elementor 2026.
Quick answer
Our study of 363 UK business websites that use Elementor found that loading was the weak point. Only 5.5% loaded their main content within Google's 2.5-second target on mobile, while servers were quick and most layouts were stable. The slowest sites tended to be the heaviest, and Google most often flagged render-blocking files, unused code and image delivery.
On this page
How we tested 363 Elementor websites
How do Elementor websites score on Core Web Vitals?
What's actually slowing down Elementor Websites?
Are some industries slower than others?
Does your Elementor version make a difference?
Should you be thinking about Elementor V4?
How can you speed up your Elementor website?
What are the key findings?
- 1 in 5business homepages we found on Google Maps showed signs of Elementor (365 of 1,955)
- 60 out of 100was the median mobile performance score. Only 6% scored 90 or above
- 5.5%loaded their main content (LCP) within Google's 2.5-second target in its mobile test. The median was 9.6 seconds
- 87%had good layout stability, and only 10 of 363 had a slow server response (over 600ms)
- 92%were flagged for render-blocking files, Google's most common suggestion
- 16%were still running an older Elementor 3.x version
- 55%of the 49 sites with real-visitor data passed Google's Core Web Vitals assessment
How we tested 363 Elementor websites
Our test started with a Google Maps search for businesses in the seven industries we work with most, across eight UK cities: London, Bristol, Manchester, Birmingham, Leeds, Cardiff, Glasgow and Nottingham. That search returned 2,400 listings with a website. Once we'd removed duplicates, directories and social media profiles, we were left with 2,134 business websites, and 1,955 of their homepages loaded.
Next, we checked each of those homepages for signs of Elementor in the code: its plugin files, CSS classes or generator tag. We found it on 365, around one in five. After removing one overseas site and one that didn't return a result, we had 363 to test.
- 2,400Google Maps listings with a website
- 2,134business websites after removing duplicates, directories and social profiles
- 1,955homepages that loaded
- 365showed signs of Elementor
- 363tested in Google PageSpeed Insights
We ran every homepage through Google PageSpeed Insights on mobile, which gives two kinds of results. The first is Google's mobile lab test, which loads the page on a simulated mid-range phone over a throttled 4G connection. Every site gets one, so it gives a like-for-like comparison, although Google notes that lab results can differ from what real visitors may experience. The second is real visitor data: Google's 28-day record of real Chrome users, and the data behind its Core Web Vitals pass or fail. Only sites with enough traffic have it, which was 49 of our 363.
There are limits to what one test can tell you. We tested homepages only, once each, and lab scores can move by up to 10 points between runs, so any single score is a snapshot. Some industries also had far fewer sites than others (only 13 cafés, for example), so we've kept sector comparisons light. We also checked each site's business type and left 20 sites that didn't fit our seven sectors (10 architects and 10 other businesses) out of the sector comparison. Finally, we've kept every site anonymous, because this is about patterns rather than naming anyone.
How to cite this study: Nivo, The State of UK Elementor 2026 (363 UK business websites tested with Google PageSpeed Insights, 26 October 2026), nivo.co.uk/elementor-performance-uk-study/.
How do Elementor websites score on Core Web Vitals?
The median mobile performance score was 60 out of 100. Google counts 90 and above as good and anything under 50 as poor. Only 6% of sites we tested reached 90, and 20% were under 50. The other 74% sat in the middle band, which Google labels "needs improvement".
- 20% Poor (0–49)
- 74% Needs improvement (50–89)
- 6% Good (90–100)
Alongside that score, Google's Core Web Vitals measure three things: how quickly the main content loads (Largest Contentful Paint, or LCP), how stable the layout is while it loads (Cumulative Layout Shift, or CLS), and how quickly the page responds when you tap or click (Interaction to Next Paint, or INP). In our test, each told a very different story.
Loading (LCP) is where most sites fall down
Largest Contentful Paint (LCP) measures how long the largest image or block of text in view takes to appear. Google's target is 2.5 seconds or less.
In Google's mobile test, the median Elementor homepage took 9.6 seconds, with only 5.5% hitting the 2.5-second target. 84% took over 4 seconds, which Google labels "poor". For us, it was the clearest finding in the study.
Layout stability (CLS) mostly holds up
Cumulative Layout Shift measures how much a page jumps around as it loads, for example, when an image or banner pushes the text down just as you go to tap it. Google's target is a score of 0.1 or less.
This was the healthiest of the three in the lab: 87% of sites had good layout stability in Google's mobile test.
Responsiveness (INP) is mostly fine
Interaction to Next Paint measures how quickly a page reacts when someone taps, clicks or types. Google's target is 200 milliseconds or less.
INP can only be measured with real visitors, so Google's lab test uses Total Blocking Time (TBT) instead, which web.dev describes as a way to help diagnose INP problems. 67% of sites had good TBT (200 milliseconds or less). Among sites with real-visitor responsiveness data, 88% had good INP.
Put all three lab checks together (LCP, CLS and TBT) and only 3% of sites passed everything in Google's mobile test. Loading was almost always the one holding them back.
| Check | Bar | Sites |
|---|---|---|
| Loading (LCP)2.5s or less | 5.5% | |
| Layout stability (CLS)0.1 or less | 87% | |
| Blocking time (TBT)200ms or less | 67% | |
| All threepassed every lab check | 3% |
84% of sites took over 4 seconds.
What real visitors experience
The picture looks better with real visitors. Google only collects this data for sites with enough traffic, and 49 of ours qualified. Just over half of them (55%) passed Core Web Vitals. Because these are the busier sites, that isn't a figure for every small business. Loading was still the weak spot, though: when a site failed, slow loading was part of the reason 86% of the time.
- Passed with real visitors: 27 (55%)
- …but still took over 4s in Google’s mobile lab test: 17 of the 27
- Did not pass: 22. Slow loading was part of the reason 86% of the time
The gap between lab and real-world results isn't a contradiction. According to Google's web.dev, real visitors often have parts of a site cached already, while lab tests usually load a page from scratch (web.dev explains why the two differ). 17 of the 27 sites that passed with real visitors still took over 4 seconds to show their main content in Google's mobile test. Passing with real visitors doesn't necessarily mean a fast first visit.
That's also why we wouldn't chase a perfect score. Search Engine Land argued in October 2026 that once a page meets Google's Core Web Vitals thresholds, extra speed work is usually wasted effort. It points out that Google confirms Core Web Vitals are used in its ranking systems, but also says a perfect score may not be the best use of your time. In our view, the real-visitor result is the one to act on: if your site fails it, start with loading, and if it passes, clearer pages and an easier way to get in touch are likely to matter more. Most of the sites we tested didn't have real-visitor data, though. For those, we'd use the lab test to find what's slowing the page down, rather than as a score to perfect.
What's actually slowing Elementor websites down?
A test like this can't prove exactly what caused each slow page. What it can show is where the time wasn't being lost, what Google flagged, and what the slow sites had in common.
Server response, the time a site takes to start sending the page, was rarely slow. The median was 78 milliseconds, and only 10 of the 363 sites took longer than 600 milliseconds. Layouts were stable on 87% of sites.
For every page it tests, Google lists the changes it estimates would speed it up. The same few came up again and again:
| What Google flagged | Bar | Share of sites |
|---|---|---|
| Render-blocking requests | 92% | |
| Unused CSS | 75% | |
| Unused JavaScript | 63% | |
| Short cache lifetimes | 62% | |
| Image delivery | 56% | |
| Font loading | 47% |
These are Google's estimates of where time could be saved. They aren't a confirmed diagnosis.
The median homepage was about 3MB. 95 sites were over 5MB, and 40 were over 10MB. The heavier the page, the slower it was to show its main content:
| Homepage size | Median loading time (LCP) in Google’s mobile test | Median LCP | Hit the 2.5s target |
|---|---|---|---|
| Under 1MB43 sites | 3.3s | 33% | |
| 1–2MB81 sites | 7.2s | 4% | |
| 2–5MB144 sites | 11.2s | 1% | |
| Over 5MB95 sites | 20.7s | 1% |
The line marks Google’s 2.5-second target.
That's a strong link, though not proof on its own. Page weight may go hand in hand with other things we didn't measure.
Nivo's Website Department Lead, Sadie O'Callaghan, has her own view. "One of the biggest things I've noticed is that website performance isn't necessarily down to Elementor itself, but how the website has been built," she says. "Too many plugins, oversized images, unnecessary animations and poor hosting can all have a big impact."
We often find add-on plugins loading their own CSS and JavaScript on pages that don't use it, which would show up in Google's report as unused code.
Plugins aren't the only place extra code can come from. The way a page's layout is built matters too. O'Callaghan points to Elementor's Flexbox Containers, which she says create layouts with less unnecessary HTML than the older sections and columns. That suggests sites still built the old way may be carrying code they don't need.
Are some industries slower than others?
A little. But in every sector, most sites missed Google's loading target in its mobile test.
| Industry | Median score | Scored under 50 | Median LCP (Google’s mobile test) | Good TBT |
|---|---|---|---|---|
| Law firms41 sites tested | 58 | 27% | 10.3s | 51% |
| Interior designers23 sites tested | 64 | 26% | 10.2s | 65% |
| Trades96 sites tested | 62 | 21% | 8.5s | 66% |
| Accountants73 sites tested | 60 | 19% | 7.4s | 68% |
| Construction53 sites tested | 64 | 15% | 9.2s | 75% |
| Cafés13 sites tested | 61 | 15% | 14.8s | 69% |
| Care providers44 sites tested | 60 | 14% | 12.3s | 70% |
Sorted by the share of sites scoring under 50, highest first. 20 sites (10 architects and 10 businesses outside these sectors) aren’t shown here but are included in every other figure.
Law firms had the highest share of sites scoring under 50 (27%) and the fewest with good Total Blocking Time (51%). We'd usually look first at heavy scripts such as chat widgets, booking tools and tracking.
Construction and interior designers had the highest median score, at 64 each. Cafés had the slowest median loading time in Google's mobile test (14.8 seconds), but with only 13 sites we wouldn't read too much into it. Care providers were next at 12.3 seconds, although they had the lowest share of sites scoring under 50 (14%).
If you're in one of these sectors, your own site's results matter more than your industry's ranking.
Does your Elementor version make a difference?
It seems to, a little. Sites on Elementor 4.x had a median score of 61, and 18% scored under 50. Sites still on 3.x had a median of 58, and 27% scored under 50.
That doesn't prove that updating Elementor speeds a site up. A site that's kept up to date is probably being looked after in other ways too. 59 of the sites we tested (16%) are still running Elementor 3.x, and some are as far back as version 3.19.
- Elementor 3.x27%scored under 50Median score 58 · 59 sites (16%)
- Elementor 4.x18%scored under 50Median score 61
| Without Elementor Pro | 29% | |
|---|---|---|
| With Elementor Pro | 17% |
Correlation, not cause: a site that’s kept up to date is probably being looked after in other ways too.
Updates matter for more than speed. "The more plugins a website relies on, the more potential there is for compatibility issues, particularly following WordPress or Elementor updates," says O'Callaghan. She recommends regular maintenance for plugin updates, PHP compatibility checks, caching, and testing that everything still works after each update.
There was a similar gap for Elementor Pro. 29% of sites without Pro scored under 50, against 17% with it. Again, we'd read that as a sign of how much care went into the build rather than Pro itself making sites faster.
Should you be thinking about Elementor V4?
Our crawl couldn't tell which sites use V4's new features, so this section draws on Elementor's documentation and our team's experience rather than the data.
V4 changes how Elementor sites are styled. Instead of styling every widget one at a time, you create classes and reusable components once and apply them across the site. According to Elementor's V4 FAQ, new sites have V4's features switched on by default from April 2026. Existing sites can opt in when they're ready, and older widgets keep working alongside the new ones.
O'Callaghan has been following Elementor's V4 updates and webinars. "One of the biggest benefits I can see is the ability to create more consistent websites without having to style every individual widget," she says. In practice, that means changing a style once and seeing it update everywhere it's used. She thinks this could make a big difference for agencies managing multiple websites, particularly for site-wide design changes.
We've put this into practice on our own website. When we rebuilt nivo.co.uk, we created 50 reusable section layouts, 10 components, 22 global classes and 27 global variables. O'Callaghan says it's a good example of how we've been using Elementor's newer features to improve consistency and speed up development.
On speed, Elementor says V4's new elements produce cleaner code and better Core Web Vitals, but its V4 FAQ doesn't include figures to back that up. We don't expect V4 to fix a site that's overloaded with plugins and huge images. Fix those first, then move to V4 as part of a planned V4 upgrade. If you're weighing it up, our guide on whether to upgrade to Elementor V4 goes into more detail. If you're planning the move, our free Elementor V4 readiness checklist covers what to check first.
How can you speed up your Elementor website?
Start by testing your own homepage in PageSpeed Insights on mobile. Look at two things: whether there's a real-visitor section at the top, and what's listed under the diagnostics. We use PageSpeed Insights alongside GTmetrix to find what's slowing a site down.
Then work through the fixes in the order our crawl found them most often:
Cut what blocks the page from loading.Render-blocking CSS and JavaScript were flagged on 92% of sites. A good caching and optimisation setup can delay or combine files that don't need to load first.
Remove plugins you don't need.Where possible, we've moved to Elementor's own widgets instead of add-ons. We've found that fewer plugins means less unused code and fewer things that can break after an update.
Resize and compress images.Use the right size for where an image appears, in a modern format like WebP. The hero image usually matters most, because it's often the element Google times for LCP.
Set proper caching.62% of sites had short cache lifetimes, so returning visitors download the same files again.
Tidy up fonts.Load fewer font weights, and make sure text shows while fonts are still loading.
Check your hosting.It wasn't a common problem in our test, but a slow server response delays everything that follows.
On client sites, O'Callaghan says removing unnecessary elements, optimising images and reducing plugin use have all brought improvements. Our guide on why your Elementor website is slow goes through these in more depth. If you'd rather hand it over, that's what our Elementor speed optimisation service is for.
What does a well-built Elementor website look like?
We think most of this can be fixed without leaving Elementor. Our published case study for Little Bagel Co. shows what can change when a site is rebuilt in Elementor.
Little Bagel Co., a food and drink business, moved to a new WordPress and Elementor site built by our team. Its Google PageSpeed score went from 32 to 67 on mobile and from 62 to 99 on desktop, and its GTmetrix grade went from B to A.
- Mobile PageSpeed32→67from 32 to 67
- Desktop PageSpeed62→99from 62 to 99
- GTmetrix gradeB→Afrom B to A
We've done the same with our own site. When we rebuilt nivo.co.uk, we built it around reusable components and a consistent design system, and kept extra plugins to a minimum. We also tested Elementor MCP with Claude as part of the build. O'Callaghan sees AI's main value as "speeding up repetitive tasks and helping maintain a consistent design system, rather than replacing the actual design and development process."
If you want more examples, have a look at our round-up of the best Elementor websites.
So, is Elementor slow?
We only tested Elementor sites, so this study can't rank Elementor against other builders, and our data can't separate Elementor from everything else on a site. What it does show is that servers were quick, layouts were mostly stable, and the slowest sites tended to be the heaviest ones. Google's most common suggestions were to cut render-blocking files and unused code and to improve image delivery.
If your site is one of them, we'd say this rarely means starting again on a different platform. More often, it means a careful clear-out, sensible caching and regular updates.
Free speed comparison
How does your Elementor site compare?
Send us your website address and we'll run your homepage through the same Google test we used for these 363 sites. You'll get a short summary showing how your site compares with the study, plus the three fixes we'd make first. It's free, there's no call to book, and you're under no obligation afterwards.
You send us your homepage address.
We test it with Google PageSpeed Insights on mobile, the same test we used for these 363 sites.
We email you how it compares with the study, plus the three improvements we'd make first.
Request your free comparison
Three quick details and we'll take it from there.
Already know you want it looked after? Hosting & Maintenance is £55 a month + VAT. See the plans →
Planning a new Elementor website? Have a look at our web design packages. If you want to build it faster and more consistently, our Claude + Elementor setup guide shows you how to get started.
FAQs
Is Elementor bad for Core Web Vitals?
Our data can't answer that on its own, because we didn't test other builders. In our test of 363 UK Elementor sites, 87% had good layout stability, and server response was rarely slow. Loading was the weak point, and it was strongly linked to page weight. Google most often flagged render-blocking files, unused code and image delivery.
What is a good PageSpeed score for an Elementor website?
Google counts 90 or above as good, 50 to 89 as needing improvement and under 50 as poor. The median Elementor homepage in our test scored 60 on mobile, so anything above that puts you ahead of at least half the sites we tested. You don't need 100, though. If your site passes Core Web Vitals with real visitors, we'd spend the time on clearer pages and an easier way to get in touch before chasing the last few points.
Does Elementor Pro slow down your site?
Our data doesn't show that. Sites with Pro were less likely to score under 50 than sites without it (17% against 29%). We'd put that down to how carefully those sites were built rather than to Pro itself.
Why is my PageSpeed score different from my real-user Core Web Vitals?
The score comes from Google's simulated mobile test, which assumes a first visit on a modest phone and connection. Real-user data is collected from actual Chrome visitors over 28 days. Google's web.dev notes that real visits are often faster, so it's possible to pass Core Web Vitals and still have a low score.
Will upgrading to Elementor V4 make my site faster?
Elementor says V4's new elements produce cleaner code, but it hasn't published speed figures. We've found the bigger gains come from removing unneeded plugins, optimising images and fixing caching. V4 is worth planning for, but it won't fix those problems on its own.
Should I rebuild or optimise a slow Elementor website?
Most of the issues Google flagged can usually be fixed without a rebuild. A rebuild makes more sense if the site is still built with old sections and columns, relies on lots of add-on plugins, or needs a redesign anyway. If that's you, our website redesign page explains how we approach it.